Infographic Amazon's Acquisitions Here's a look at some of Amazon's acquisitions and their integration into the family.
Infographic The Meteoric rise of UPI How the UPI transactions have increased in value over the years.
Infographic Breaking down revenue streams of Google (Alphabet) A few weeks ago Google posted its quarterly earnings, so we wondered how the behemoth makes its money. Here's an infographic that breaks down Google's (Alphabet) revenue streams.
Infographic Sector-wise FDI inflows into India Sector-wise contribution of Foreign Direct Investment (FDI).
Infographic India's commodity-wise exports by revenues Sectorwise contribution of exports revenues for India.
Infographic India's stock market is now the 7th largest globally Comparing the market cap of the top 10 countries.
Infographic How much does each state contribute to GST collections? State-wise GST collections for 2019-20.
Infographic India's richest businesswomen An infographic on India's richest businesswomen and their wealth.
Infographic India's richest businessmen An infographic on India's richest businessmen and their wealth.
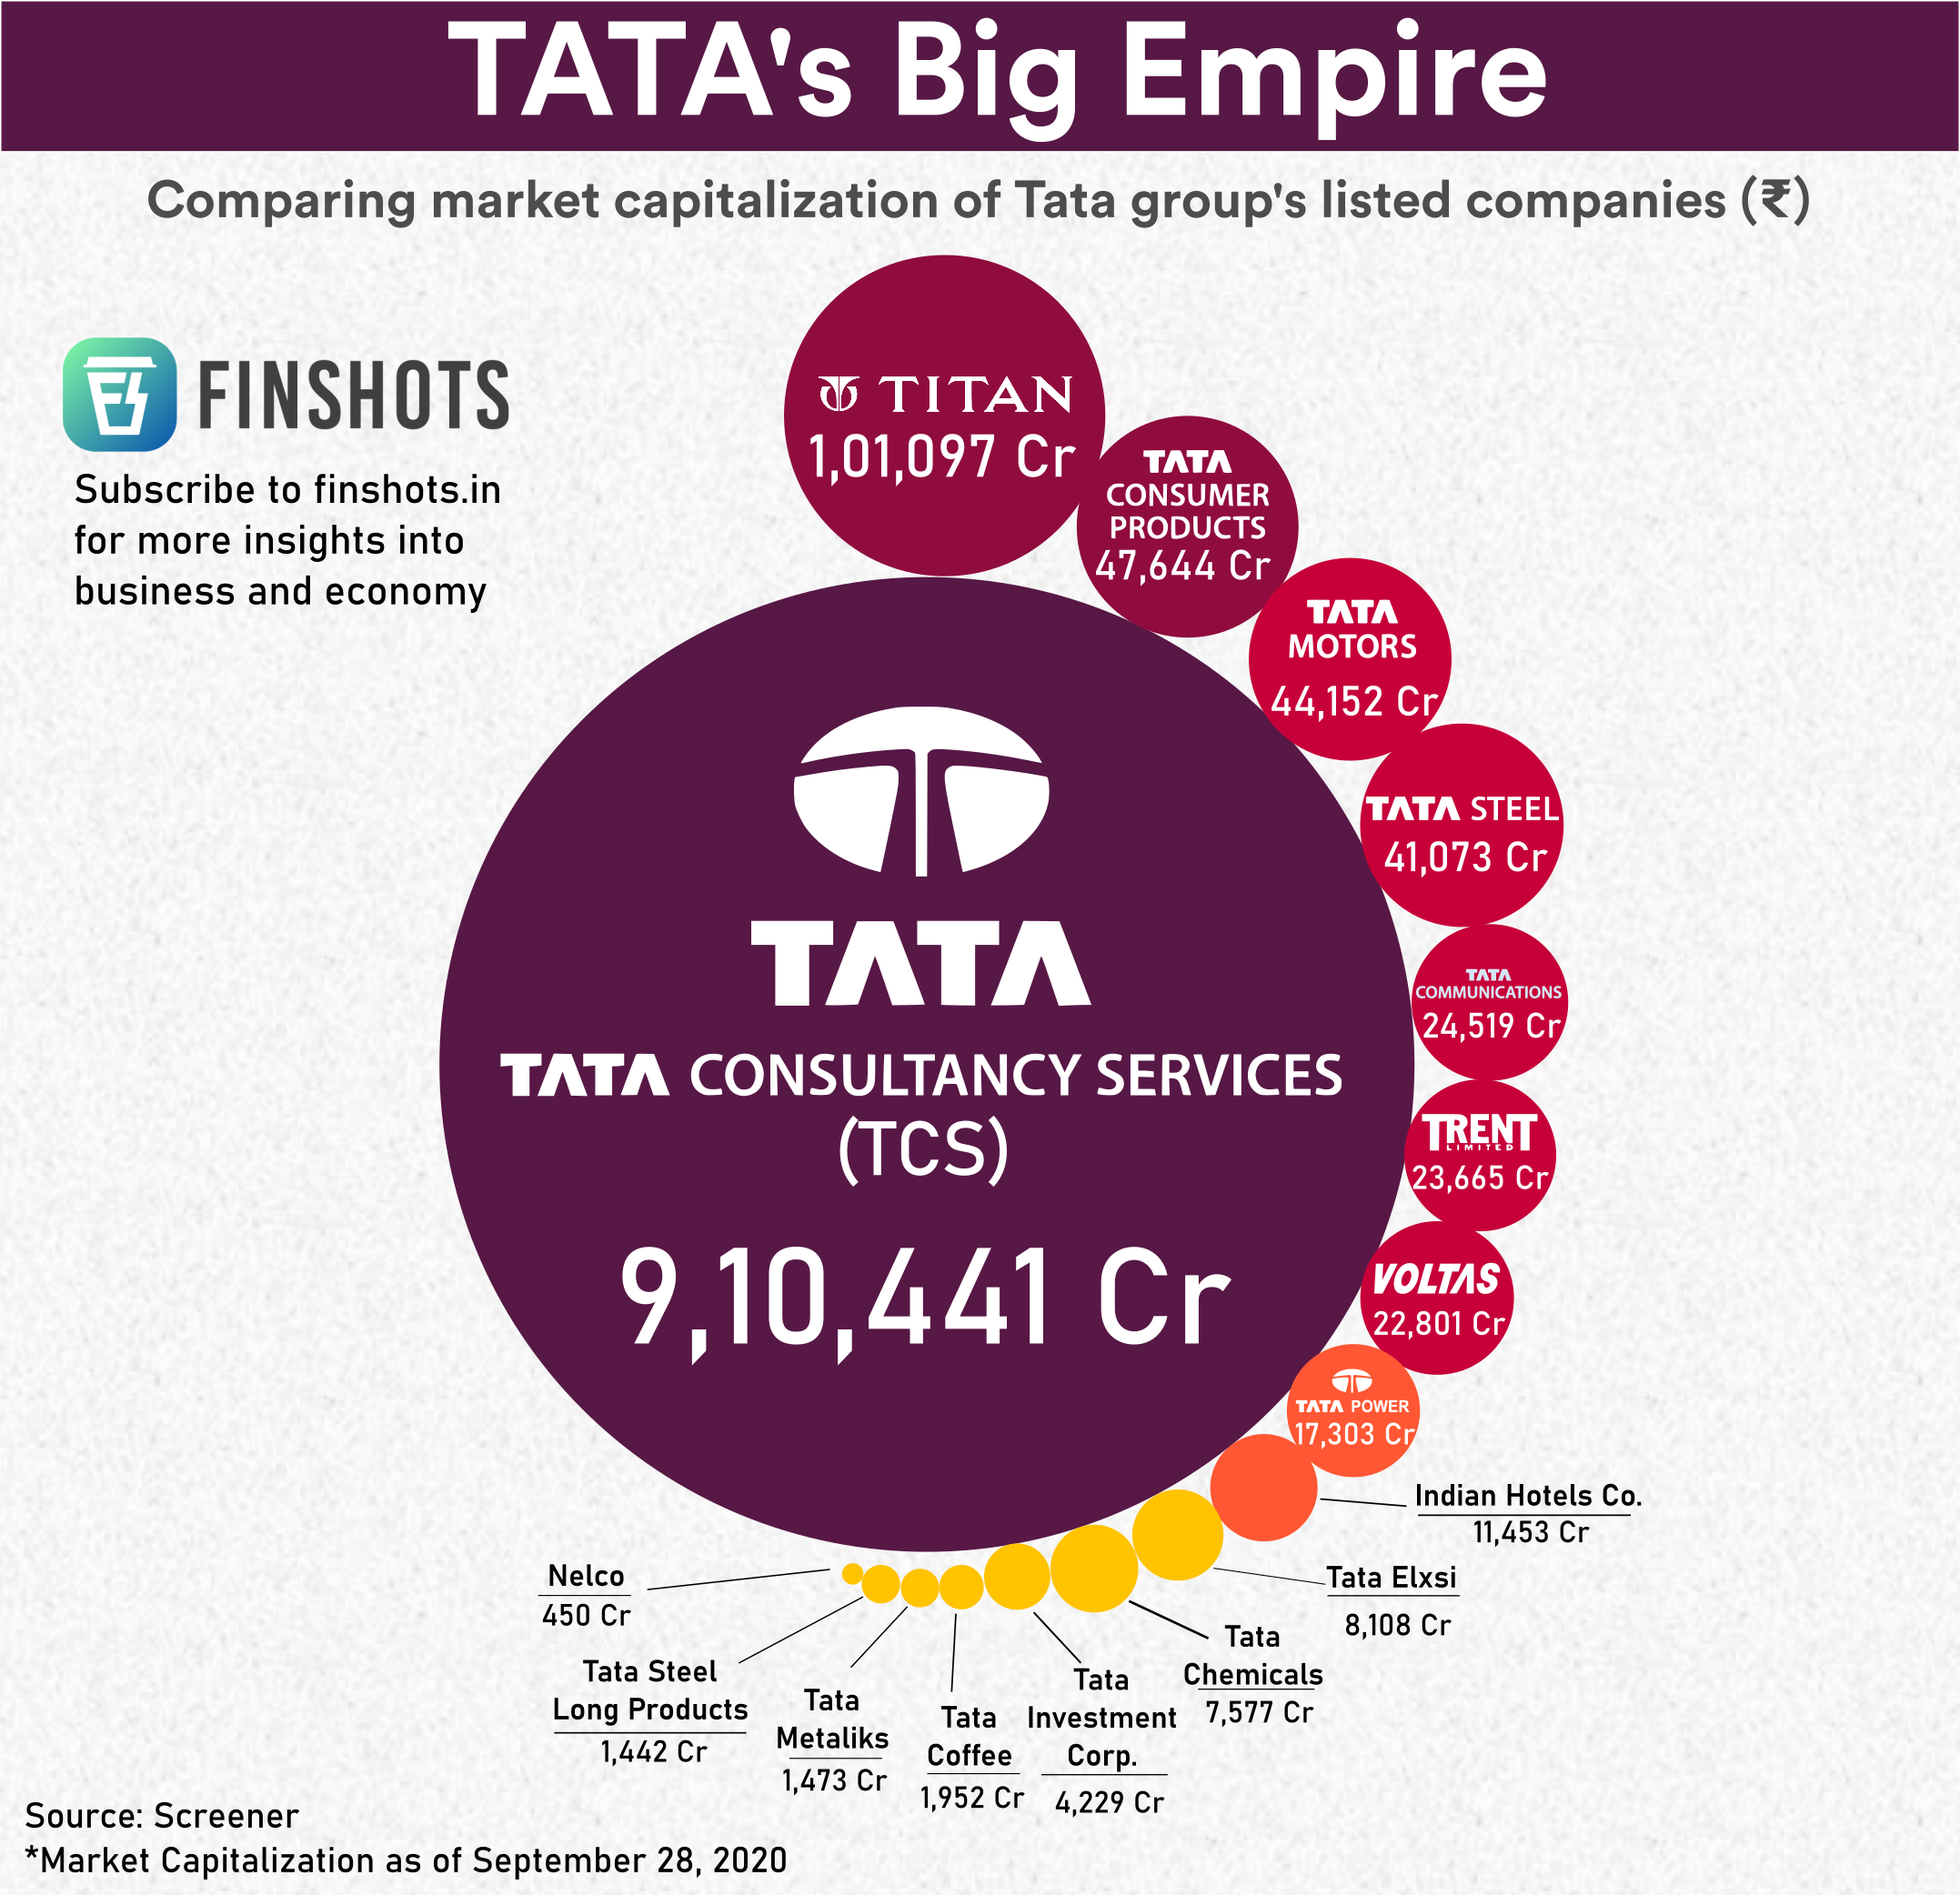
Infographic Top 5 Indian companies by market-cap across decades Here's how the top 5 Indian firms by market cap have changed over the years.
Infographic Facebook's Acquisitions With all the recent news surrounding Facebook and how it buys up rivals to eliminate competition, we thought it would be ideal to look at some of its acquisitions and their industries.
Infographic Who rules the UPI payments? NPCI recently released data on the number of transactions done by various UPI Payment apps.
Infographic Tesla is now bigger than the other top six automakers combined Comparing Tesla's marketcap with other automakers
Infographic Reliance's Acquisitions Reliance Retail acquired Urban Ladder yesterday. So, we thought we can take a look at Reliance's acquisitions over the years.
Infographic Flipkart's Investments Flipkart recently acquired a 7.8% stake in Aditya Birla fashion. So we thought we can look at some of Flipkart's big investments.
Infographic Largest loss-making companies in India (Jul'19 - Jun'20) Some of the largest loss-making listed companies in India.
Infographic Largest profit-making companies in India (Jul'19 to Jun'20) Some of the largest profit-making public companies in India.
Infographic India leads the world in milk production India contributes to ~23% of the World's milk production.
Infographic Is UPI the greatest innovation in digital banking? Visualizing the growth of monthly transaction amount on UPI.
Infographic India's GDP contracted by -23.9% this quarter Comparing quarterly GDP growth rate over the the last four years.
Infographic Apple's market cap crosses $2 trillion Apple became the first American company to cross a market cap of $2 trillion (₹150 lac crore). So, we thought we can take a look at how Apple makes its revenues.